Tweezer Bottom Pattern: Meaning and What It Indicates?
In a rapidly changing world, investors look for quick money instead of patiently investing in long-term conventional investments. As a result, the stock markets have gained a great deal of attraction from the young population.
With the flexibility of fluid funds, you can choose to block your funds for short-term trading or long-term investing. The markets provide high liquidity for you to maneuver according to your needs. However, stock markets are volatile and can lead to heavy losses if you invest recklessly.
Investors use tools like fundamental and technical analysis to understand the stocks. These tools help minimize the investment risk. One such technical analysis indicator is the tweezer bottom pattern. In this blog, we cover all the ins and outs of this pattern.
What Is Tweezer Bottom Double Candlestick Pattern?
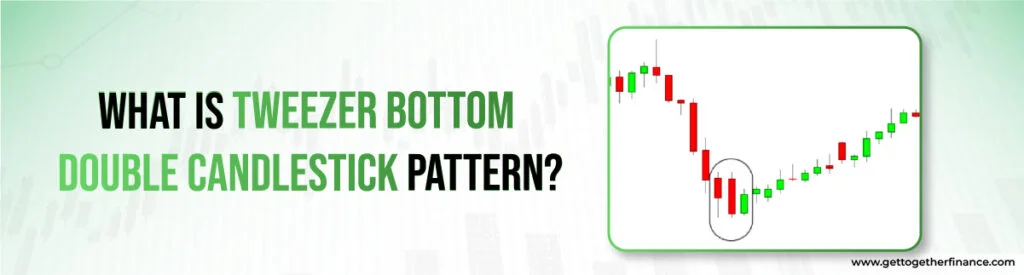
Have you heard about the candlestick charts? These are the most widely used chart types by investors to identify lucrative investment opportunities. The tweezer bottom pattern is one of the powerful candlestick patterns that shows trend reversal. It gets its name from a pair of tweezers, a tool having 2 arms similar to the grip of tweezers.
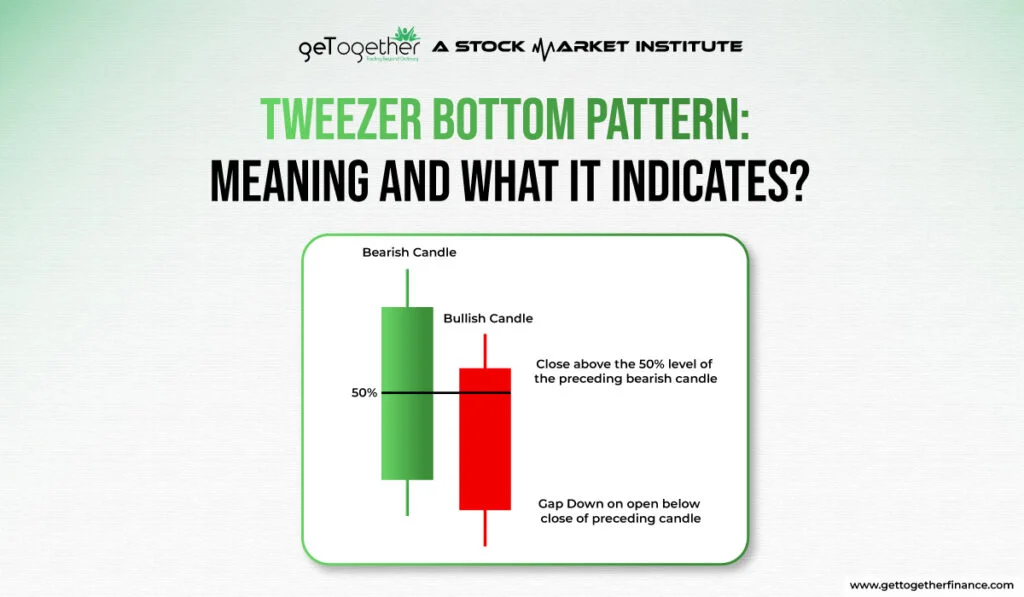
Here are the key characteristics of the tweezer bottom candles:
- Formation: It consists of 2 or more consecutive candles at the bottom of a downward trend:
- 1st Candle is the bearish candlestick (Red)
- 2nd Candle is a bullish candlestick (Green)
- Almost equal low prices: All the candlesticks should have an almost equal lower price.
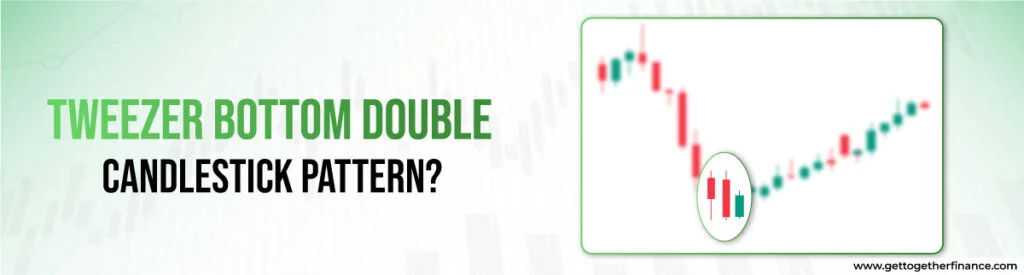
As you can see in the above image, 3 consecutive candles form a similar low, showing the existence of a tweezer pattern. Usually, the tweezer bottom pattern consists of 2 candles only, but sometimes it can have 3 candles as well.
Also Read: Symmetrical Triangle Pattern
What Does Tweezer Bottom Pattern Indicate?
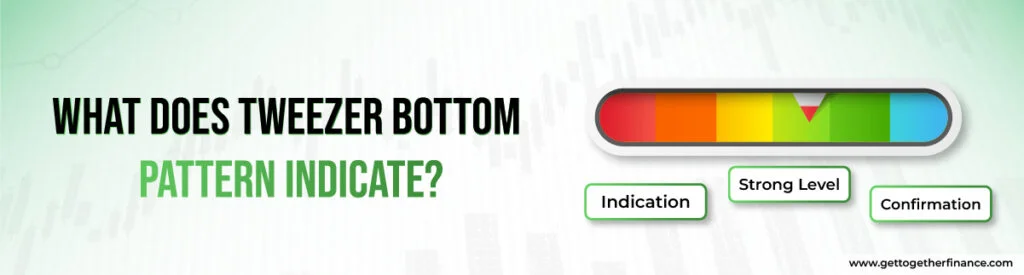
Having seen how the pattern looks, you would ask what does the pattern say? Here’s how you can interpret it:
- Indication: The pattern shows that sellers are exhausted and buyers have gained momentum. So much so that the trend is reversed from bullish to bearish.
- Strong Level: The tweezer bottom shows that buyers have created support for the stock price at this level to prevent the price from falling any further.
- Confirmation: The mere formation of a tweezer bottom is not enough. If it is accompanied by the following, the pattern is considered strong:
- Follow-up candles forming higher highs
- Other bullish candlestick patterns forming
- Higher volumes
Importance of The Tweezer Bottom Pattern for Stock Market Technical Analysis
The tweezer bottom chart is significant for technical analysis. Here’s why traders give it such high weightage:
- Strong Pattern: It is inherently a strong pattern.
- Trend Reversal: The strength of the pattern is shown by the fact that buyers not only restrict the selling pressure but also reverse the trend.
- Confirmation: It is easy to confirm as a bullish candle following the tweezer bottom is enough.
- Entry & Exits: It’s easier to identify the entry & exit points in the tweezer bottom pattern.
Restrictions while using the Tweezer Bottom pattern
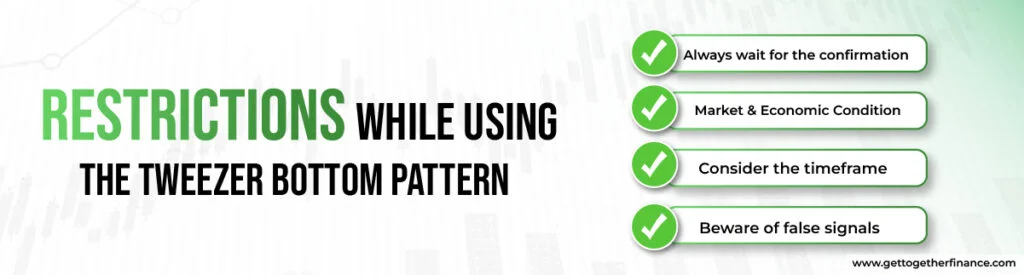
While a tweezer bottom is a strong pattern, it is not foolproof. In such circumstances, if you don’t follow certain restrictions and make impatient moves, it can be disastrous. Here are certain steps you should follow:
- Always wait for the confirmation: Additional technical indicators along with the tweezer bottom pattern like:
- Higher highs formed by candlesticks
- Bullish candlestick patterns, and
- Increased volumes
- Market & Economic Condition: It is also important to check the condition of the stock market & the economy overall. Sometimes individual stocks can react to a larger move of the stock market.
- Consider the timeframe: A tweezer bottom pattern built over a longer period is stronger compared to a shorter timeframe.
- Beware of false signals: You can never be 100% sure about any technical chart pattern. What if the same candlesticks form a tweezer top and bottom? This may cause uncertainty, leading to a tweezer cross. In such a situation, traders cannot predict anything, and prices can break out in any direction.
Example of a Tweezer Bottom Pattern
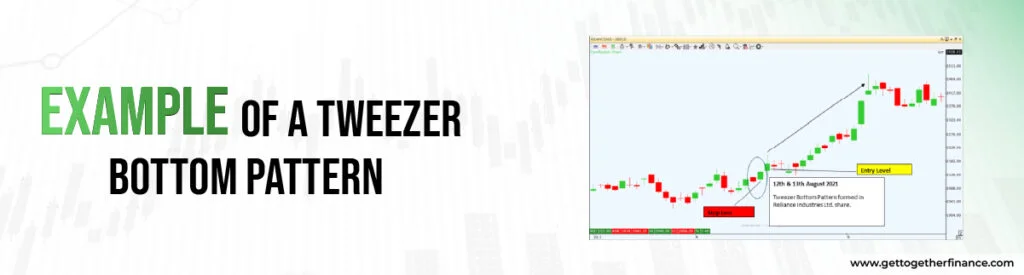
Here’s an example of the tweezer bottom pattern:
Stock: Reliance Industries Limited
Exchange: NSE
Dates: 12th & 13th August 2021
Chart Time: Daily
| Particulars | 12th August 2021 | 13th August 2021 | 16th August 2021 |
| Type of Candle | Bearish | Bullish | Bullish (Higher Highs) |
| Lower Price | Rs. 2,105.00 | Rs. 2,108.95 | Rs. 2,128.15 |
| Higher Price | Rs. 2,126.20 | Rs. 2,149.90 | Rs. 2,203.00 |
| Volumes | 37,55,507 | 58,98,384 (1.57 times) | 1,01,23,204(2.70 times) |
Interpretation:
- A tweezer bottom formation is clearly visible.
- The lowest price of both bullish & bearish candlesticks is in close proximity.
- All the candles are making higher highs
- The volumes have grown more than 1.5 times on day 2 & 2.7 times on day 3
Result:
- The stock price touched a high of Rs. 2,480 on 6th September 2021
- The up move continued until a strong tweezer top was formed on 19th & 20th October 2021 at price levels around Rs. 2,750
- If you entered the trade at the right time, you could have gained up to 30% within the span of 2 months
From the above tweezer bottom example, you can see that if you perform good research and study all the parameters discussed earlier in this blog, you can expect good returns with minimum risk.
Trading Tweezer Bottom Patterns
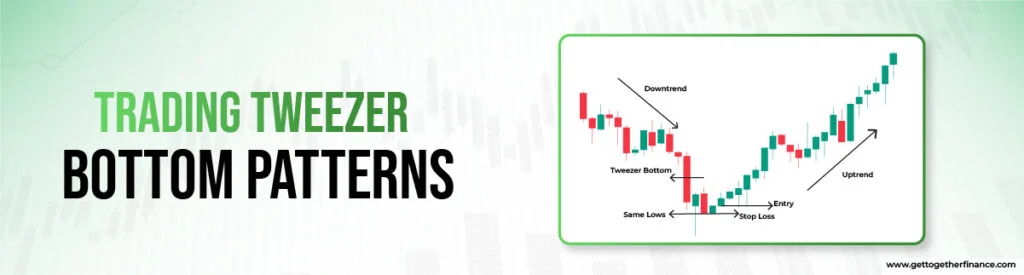
Now that you have seen how to identify the pattern correctly, the next query is about the Tweezer bottom entry & exit levels while maintaining a practical stop loss.
- Entry Level: The opening price of the 4th candle, i.e. right after the confirmation candle when you are certain about the formation.
- Stop Loss: You can place the stop loss below the lower wick of the 2 tweezer candles.
- Exit Level: Your exit level can be any of the following targets:
- Based on the height of the pattern
- Based on the support/resistance levels
- When you see reversal signals like tweezer top
Mistakes Traders make while trading the Tweezer Bottom

At this stage, you are well equipped to understand a tweezer bottom and ride the tide. But, the biggest mistakes you can make as a trader are being complacent or overconfident. Well, here are some of the mistakes you should avoid while entering a tweezer bottom trade:
- Not confirming the pattern: If you miss the trick to confirm the pattern, you might suffer a loss.
- Not Putting a Stop Loss: Humans are prone to errors. Instead of making it an ego point, you should maintain a stop loss to minimize your risk. Otherwise, you might end up eroding your corpus.
- Ignore Reversal Signals: If you become greedy and ignore the indications of trend reversal, it can lead to losses. To avoid this, you can also put a trailing stop loss, i.e. putting a stop loss at upward prices to avoid losing the profits.
To Sum it Up…..
- Bullish Reversal: Tweezer Bottom shows a trend reversal towards a bullish move.
- Exhaustion of Selling Pressure: Equal lows suggest that the selling pressure has been exhausted and buyers are on top.
- Confirmation: Higher highs and increased volumes are a litmus test for a tweezer bottom pattern.
- Entry, Exit & Stop Loss: Identifying the appropriate entry, exit & stop loss can maximize your profits.
- False Signals: If the same candles form tweezer bottom & top patterns, it shows indecision. Such false signals can be dangerous with half knowledge.
Exit Strategy: Exit the trade based on predetermined targets, reversal signals, or trailing stop-loss orders.
FAQs
u003cstrongu003eWhat is the Tweezer Bottom pattern in trading?u003c/strongu003e
It is a bullish reversal pattern observed in candlestick charts. It is formed when two consecutive candlesticks with almost equal lows are seen on the chart. It indicates the potential exhaustion of selling pressure signalling a reversal from a downtrend to an uptrend.
u003cstrongu003eHow is the Tweezer Bottom pattern identified on a price chart?u003c/strongu003e
u003cstrongu003eTweezer Bottomu003c/strongu003e is formed when two consecutive candlesticks having almost equal lows are seen on a price chart. If the pattern is followed by a candle making higher highs along with increased volumes, it indicates a strong formation.
u003cstrongu003eCan you explain the significance of the Tweezer Bottom pattern?u003c/strongu003e
The u003cstrongu003eTweezer Bottom patternu003c/strongu003e signifies the potential exhaustion of selling pressure and a shift from a downtrend to an uptrend. It provides traders with a bullish reversal signal, indicating a favorable opportunity to enter long positions to benefit from the upward price movements.
u003cstrongu003eWhat are the key characteristics of a Tweezer Bottom?u003c/strongu003e
Key characteristics include:u003cbru003eTwo consecutive candlesticks with similar lowsu003cbru003eIndicates a reversal from a bearish to a bullish trendu003cbru003eA strong formation is accompanied by higher highs and increased volumesu003cbru003eShows the entry u0026amp; stop loss levels that can help you gain good profits at minimum risk
u003cstrongu003eHow does the Tweezer Bottom pattern indicate potential market reversal?u003c/strongu003e
The stock markets experience a continuous tussle between the buyers and the sellers. u003cstrongu003eTweezer Bottom patternu003c/strongu003e indicates the buyers exhausting the selling pressure and reversing the trend to gain bullish momentum. This pattern implies that buyers are stepping in to support the price at that level and prevent it from falling any further.
u003cstrongu003eAre there variations or types of Tweezer Bottom patterns?u003c/strongu003e
Yes, variations of the u003cstrongu003eTweezer Bottom patternu003c/strongu003e include:u003cbru003eu003cstrongu003eLong Lower Shadow:u003c/strongu003e When the lower wick of the first candlestick is significantly longer than the second candlestick’s lower wick.u003cbru003eu003cstrongu003eEngulfing Tweezer Bottom:u003c/strongu003e When the second candlestick completely engulfs the first candlestick, indicating stronger bullish momentum.
u003cstrongu003eIn what market conditions is the Tweezer Bottom pattern commonly observed?u003c/strongu003e
As a u003cstrongu003eTweezer bottom patternu003c/strongu003e shows a trend reversal from bullish to bearish, it is commonly observed in markets experiencing downtrends or periods of heavy selling pressure. It indicates the potential exhaustion of selling momentum and a shift in sentiment from bearish to bullish. Traders look for this pattern to identify opportunities to gain from short-term trades.
u003cstrongu003eHow do traders typically interpret the confirmation of a Tweezer Bottom?u003c/strongu003e
Traders typically confirm a u003cstrongu003eTweezer Bottom patternu003c/strongu003e by observing subsequent price action, such as:u003cbru003eBullish candlestick patterns or higher highs, u003cbru003eIncreased trading volume accompanying the confirmation
u003cstrongu003eAre there specific volume considerations when trading the Tweezer Bottom pattern?u003c/strongu003e
Yes, traders consider volume when trading the u003cstrongu003eTweezer Bottom patternu003c/strongu003e. High volume suggests strong market participation and enhances the reliability of the pattern as a potential reversal indicator.
u003cstrongu003eWhat precautions should traders take when relying on the Tweezer Bottom pattern for decision-making?u003c/strongu003e
Traders relying on the u003cstrongu003eTweezer Bottom pattern u003c/strongu003eshould take the following precautions:u003cbru003eu003cstrongu003eConfirmation:u003c/strongu003e Wait for confirmation from subsequent price action.u003cbru003eu003cstrongu003eFalse Signalsu003c/strongu003e: Be aware of false signals and verify with other technical indicators.u003cbru003eu003cstrongu003eMarket Context:u003c/strongu003e Consider broader market conditions and volatility.u003cbru003eu003cstrongu003eRisk Management:u003c/strongu003e Implement proper risk management techniques to protect against losses.