
Piercing Pattern: Definition, Formation, and Strategies
As India’s growth story has picked up pace, people are experimenting with investments that were not conventionally followed in this part of the world. Just a couple of decades ago, stock markets were a thing of the elite. But over the years, the masses have broken through the shackles and started investing in the Indian stock markets.
While equity investments provide good returns and liquidity, they involve high risk. However, there are tools like fundamental & technical analysis used by investors to minimize risk in the stock markets. One such technical analysis tool is “Piercing Pattern”. Keep reading to learn how you can use this tool to your advantage!
What Is a Piercing Pattern?

As the name suggests, a piercing line pattern refers to a candlestick formation that shows the effect of piercing through an ongoing trend to reverse it. It can be both bullish & bearish depending on the preceding trend.
Bullish Piercing Pattern

So, here’s the definition of a bullish piercing pattern:
In an ongoing bearish trend, 2 consecutive candles are formed such that:
- The first candle is bearish
- The second candle is bullish and shows the following:
- A Gap down opening from the close of the first candle, and
- The price closes above the midpoint of the bearish candle, i.e. above 50%
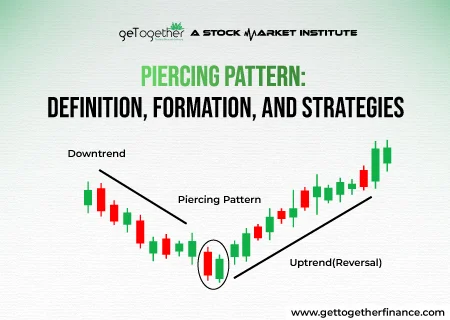
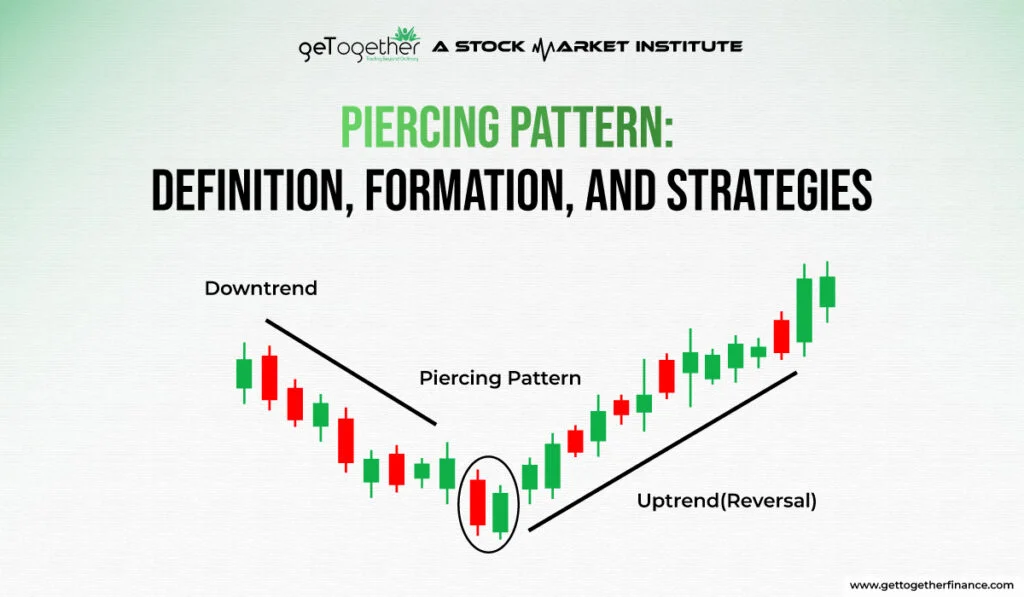
The following image represents a bullish piercing pattern.
*Red Candle: A bearish candle with a lower closing price than the opening price.
**Green Candle: A bullish candle with a higher closing price than the opening price.
Bearish Piercing Pattern (Dark Cloud Cover)

It is the polar opposite of the bullish pattern. So, here’s the definition of a bearish piercing line pattern:
In an ongoing bullish trend, 2 consecutive candles are formed such that:
- The first candle is bullish
- The second candle is bearish and shows the following:
- A Gap up opening from the close of the first candle, and
- The price closes below the midpoint of the bullish candle, i.e. below 50%
The following image represents a bearish piercing line pattern.
Also Read: Tweezer Bottom Pattern
Understanding Piercing Pattern
When we discuss the piercing line pattern, whether it is bearish or bullish, it is more important for traders to interpret it correctly to unlock the pandora’s box. Here’s a comparison to know the difference:
| Pointers | Piercing Pattern (Bullish) | Piercing Pattern (Bearish) |
| Type of Pattern | Bearish Reversal / Bullish | Bullish Reversal / Bearish |
| Aka | Bullish Piercing Line Pattern | Bearish Piercing Line Pattern / Dark Cloud Cover |
| Preceding Trend | Bearish Trend | Bullish Trend |
| Formation Candle 1 | Bearish Candle | Bullish Candle |
| Formation Candle 2 | Bullish Candle: Gap Down Opening Closes above 50% of Candle 1 | Bearish Candle: Gap up Opening Closes below 50% of Candle 1 |
| Confirmation | Indicators that confirm the pattern: Increased Volume The pattern occurs near Moving Averages The pattern occurs near important Support Level RSI indicates Oversold The 3rd candle opens with a gap up and is bullish External factors | Indicators that confirm the pattern: Increased Volume The pattern occurs near Moving Averages The pattern occurs near important Resistance Level RSI indicates Overbought The 3rd candle opened with a gap down and is bearish External Factors |
How Does a Piercing Pattern Work?

Now that you have learned how to identify the piercing pattern, the next step is to understand where you can enter the trade and what is the expected return on investment. Here’s how traders interpret the piercing price pattern to make profitable trades:
| Pointers | Bullish Piercing Pattern | Bearish Piercing Pattern |
| Type of Trade | Buy for rise in price | Sell / Short Sell for a fall in price |
| Steps to Identify | Identify the Pattern Confirm the Pattern | Identify the Pattern Confirm the Pattern |
| Entry Point | At the opening of the third candle After prices retrace a bit | At the opening of the third candle After prices recover a bit |
| Stop Loss | Just below the lower wick of the bullish candle | Just above the highest price of the bearish candle |
| Target Price | Can be decided based on: Difference between 1st Candle high & 2nd candle low Resistance Levels Historical Price Data Trendlines Comparative fundamental ratios of industry & the stock Fibonacci Retracement Recent Swing highs and lows 50-200 days moving average Formation of a bearish pattern Trailing stop loss when you are unsure of the target | Can be decided based on: Difference between 2nd candle high & 1st candle low Support Levels Historical Price Data Trendlines Comparative fundamental ratios of industry & the stock Fibonacci Retracement Recent Swing highs and lows 50-200 days moving average Formation of a bullish pattern Trailing stop loss when you are unsure of the target |
Example: Piercing Line Pattern

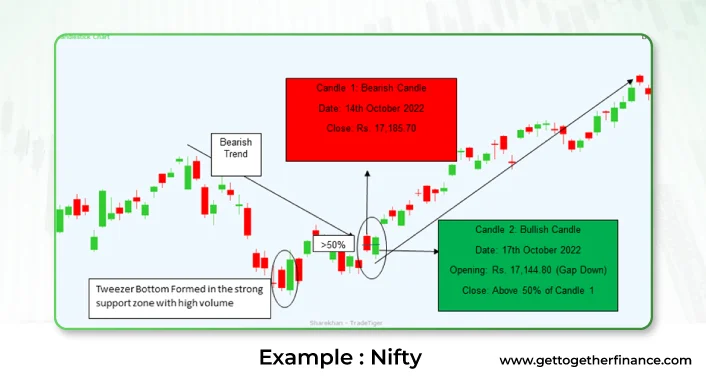
Let’s see a practical example of the Bullish Piercing Pattern in the Nifty 50 chart.
| Identification Factors | Explanation |
| Preceding Trend | A downtrend followed by a strong support zone just below the bearish candle |
| Candle 1 | Bearish Candle was formed on 14th October 2022 Closing Price: Rs. 17,185.70 |
| Candle 2 | Bullish Candle was formed on 17th October 2022 Gap Down Opening: Rs. 17,144.80 Closing Price: Rs. 17,311.80 (>50% of Candle 1) |
| Confirmation | Nifty had struck a strong support just before the piercing-pattern In the Support Zone, the chart shows the formation of a Tweezer Bottom Pattern with volumes more than 1.8 times |
| Entry Point | Opening of Candle 3 on 18th October 2022 at Rs. 17,438.75 |
| Stop Loss | Below the Lower Price of Candle 2: Rs. 17,050 |
| Target met on 1st December | As per the previous Swing Rs. 18,500 With Trailing Stop Loss: Rs. 18,800 |
| Profit within 43 days | Minimum: 6.09% (equivalent to 51.69% p.a.) Maximum: 7.81% (equivalent to 66.29% p.a.) |
The following image shows the chart of Nifty in the discussed time frame:
We use the trailing stop loss method when the target price is uncertain. As the price of a stock goes up, we place a stop-loss order below the previous closing price.
Is the piercing pattern bullish or bearish?

Piercing patterns can be both bullish or bearish, depending on the direction of the preceding trend. Here are the key characteristics of both the patterns:
- Bullish Piercing Pattern
- The market is in a downtrend with consecutive bearish candlesticks
- The price can be close to an important support level
- 2 consecutive candlesticks are formed:
- 1st Candle: A large bearish candlestick
- 2nd Candle: A bullish candlestick that opens below the previous day’s low and closes above the midpoint of the prior day’s candle
- This suggests:
- a potential reversal of the downtrend
- buying pressure has overwhelmed the selling pressure
- Bearish Piercing Pattern
- The market is in an uptrend with consecutive bullish candlesticks
- The price can be near an important resistance level
- 2 consecutive candlesticks are formed:
- 1st Candle: A large bullish candlestick
- 2nd Candle: A bearish candlestick that opens above the previous day’s high and closes below the midpoint of the prior day’s candle.
- This suggests:
- a potential reversal of the uptrend
- selling pressure has overwhelmed the buying pressure
In a nutshell
- The piercing patterns shows trend reversal
- It can be both bullish or bearish
- To confirm the pattern you should check other factors like,
- Preceding Trend
- Support/Resistance Levels
- Volumes
- RSI overbought/oversold
- External Factors
- Fundamental Analysis
- You can set the targets in many ways as discussed in this blog
- Monitor the price fluctuations closely
- Always keep a trailing stop loss as a safety net
If you follow all the steps discussed in this blog, you will be able to profit from the piercing patterns whenever you see it in a stock’s chart!
FAQs
What is the Piercing Pattern in trading?
How is the Piercing Pattern formed on a price chart?
Can you explain the significance of the Piercing Pattern in technical analysis?
What are the key characteristics of a Piercing Pattern?
A large bearish candle followed by a bullish candle
The bullish candle opens below the prior day’s low but closes above the midpoint of the bearish candle
How does the Piercing Pattern signal a potential reversal in market trends?
Are there variations or types of Piercing Patterns?
Bullish Piercing Pattern
Bearish Piercing Pattern
In what market conditions is the Piercing Pattern commonly observed?
key support or resistance levels
during periods of heightened volatility & volumes
significant price movements
What strategies do traders commonly use when recognizing a Piercing Pattern?
Confirmation signals from other indicators
Increased trading volume
Support and resistance levels
RSI trends
Overall market sentiment
Stock Fundamentals
Risk Management techniques like a trailing stop loss
Are there specific volume considerations when trading based on the Piercing Pattern?
What risks should traders be aware of when incorporating the Piercing Pattern into their analysis?
False signals that show more indecision than a pattern
Relying solely on the Piercing Pattern without considering other technical indicators
Investing in a company with poor fundamentals
Not using proper risk management tools