
Market Peaks and Troughs: Analyzing Market Cycles for Profits
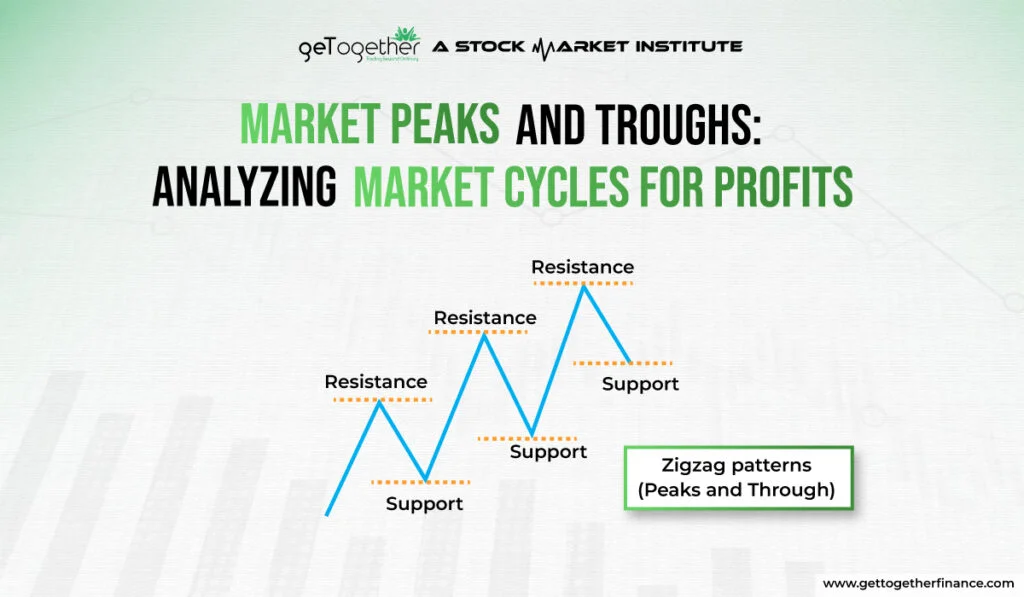
Have you seen the zigzag patterns in the candlestick charts and wondered why the price is making such patterns? Well, these zigzag patterns are called market peaks and through and they help in knowing the price movement of the stock or security in a particular time frame.
Understanding market cycles of market peaks and troughs can help investors make more profitable judgments. Peaks highlight the market’s peak or the highest point when prices are expected to decline, indicating a favorable time to sell the stock.
Troughs, on the other hand, show the market’s lowest point, implying that prices will climb, making now an excellent time to buy. Market cycles typically have four stages: growth, peak, contraction, and trough. During the growth phase, prices of the stock steadily rise, eventually reaching a high. After making the peak, the price of the stock falls throughout the contraction until it reaches a trough. Recognizing these cycles enables investors to capitalize on opportunities. However, to make informed selections, careful research, and consideration of many elements, such as economic data and market trends, are required.
Understanding Market Cycles

Market cycles are repeating patterns of growth and decline in the stock or financial market. These cycles are impacted by a variety of factors, including demand and supply dynamics, economic statistics, market sentiments, and geopolitical developments. Recognizing parts of this cycle can help investors and traders know market trends and make strategic investments.
Here’s what the market cycle comprises of:
1. Growth or Expansion Phase
The expansion or growth phase of the stock or security is like a bright day for the investors. Everything seems heading up! Business is performing well, more people are employed, and everyone is willing to buy the stock more, creating more demand. Investors are thrilled because stock prices continue to rise. Companies are making money, which increases the value of their shares. This is an excellent moment to invest because there is ample opportunity for making profits while enjoying a quick rally. So, during this time, it appears that stock is on the boom and profits are incoming.
2. Peak Phase
When the market reaches its high, it’s like being at the absolute top of a rollercoaster ride. Prices are at their high points, which indicates that things may begin to shift shortly. At this point, some investors and retailers are being optimistic that the market will go up more, but instead, it starts falling shortly. The economy is thriving, and businesses have made plenty of money during the growth phase. However, some people become overly optimistic and believe that prices will continue to rise indefinitely. This can create problems since prices may be higher than they should be and the market becomes overvalued. As a result, investors must be aware of what’s going on in the market book profits before they start to decline. It’s like after completing the terrific trip to the hilltop, you have to come back to experience more good things. The market may rise again, but booking profits is considered a safe move at this point.

3. Contraction Phase
When the market reaches its peak, it begins to decline, this period is known as the contraction phase. During this time, prices for stocks begin to decrease, and the overall momentum of the market. This can be caused by a variety of factors, including rising interest rates, strained relations between countries, or the increased supply with the way people are booking profits. Investors become fearful and uncertain about what will happen next. It’s like being in a gigantic storm, full of waves and uncertainties and not knowing what to do. Investors need to stay secure during this time, investors might diversify their investments and avoid taking risks. It’s similar to having a backup plan or a safety net: you hope you don’t need it, but it’s excellent to have just in case things get rough.
4. Trough Phase
The trough phase refers to the time when the market hits its lowest point. Stocks and market indices are at low points with continuous decline, and everything appears in red. But even in difficult times, the one with good technical analysis can know where the buying opportunity is lying. They seek out undervalued items, much like finding a gem in a pile of rubbish. As the market sentiments improve, these investments can yield significant returns. It’s like putting seeds in the ground in the winter and waiting for them to sprout when April arrives. One thing an investor always needs to remember for the Indian market is that things gradually improve, and the market is going to recover. This lays the stage for the next phase of growth, in which prices begin to rise again and everyone feels hopeful once more. So, even when things appear bad, there’s always a chance for smart investors to turn things around and make a profit.
How does market cycle analysis always work?

In an economy, the rise and dip of each sector in the stock market occurs at different time which forms a rotation cycle of the sectors. Demand and Supply of each sector keeps fluctuating wherein one sector has the highest demand and the other has the lowest. Each sector has to go through different phases; where from the top, it might hit the bottom and vice versa, thus the sectors move in a rotational cycle to experience these phases. Demand and Supply theory is helpful in examining the sector which is in the highest demand in the future. Significant sectors in the stock market such as PSU Banks, IT, Realty, Healthcare, Media, Pharma, etc are responsible to form this rotational pattern. Demand and Supply Theory identifies the lowest point of a sector when it comes in a Demand Zone of higher time frames having the potential to reach all time high price of the stock. As we have seen, once PSU Banks sector and Realty sector was at its low in the rotational cycle, increasing the expectation of being all time high, after a great rally in PSU Banks, the sector completed its rotational cycle by being at the top from the bottom.
Also Read: Technical Analysis
Conclusion
Finally, understanding market cycles, including market peaks and troughs, helps investors and traders make more educated judgements. Understanding the expansion, peak, contraction, and trough phases allows you to navigate the ever-changing environment of financial markets. While market cycle research provides a framework for forecasting trends, it’s important to remember that market movements aren’t necessarily linear. Inner market peaks and troughs within cycles provide an opportunity for skilled traders to profit on price swings. Advanced technical analysis, combined with a thorough understanding of demand and supply dynamics, increases the chances of a successful trade. While market cycles might provide useful insight, focusing only on them may not ensure success. Instead, using detailed technical research and remaining alert to market factors guarantees a more robust strategy to navigate the complexities of the financial markets.
FAQs
What are market peaks and troughs, and why are they important for investors?
How do market cycles influence investment decisions?
What are the key indicators of each phase of the market cycle?
How can investors identify opportunities during market troughs?
What are some common factors that trigger market contractions?
What strategies can investors employ to mitigate risks during market downturns?
Is market cycle analysis always reliable for making investment decisions?