
Beginner’s Guide on Technical Analysis: The Language of Stocks


Overview
The older sibling of fundamental analysis – but more disciplined, accurate, and practical.
Rising as one of the major aspects of understanding the stock market intricacies, technical analysis has taken the market by storm for its practicality, in-depth research, and confidence in patterns. You know what they say -People can lie but charts don’t.
True! But the question is do you know its language?
Before sitting in class A, let’s begin understanding the alphabets of technical analysis – including what it is, where it began, and how to use it?
Let’s dive in without wasting a jiffy.
What is Technical Analysis in Stock Market
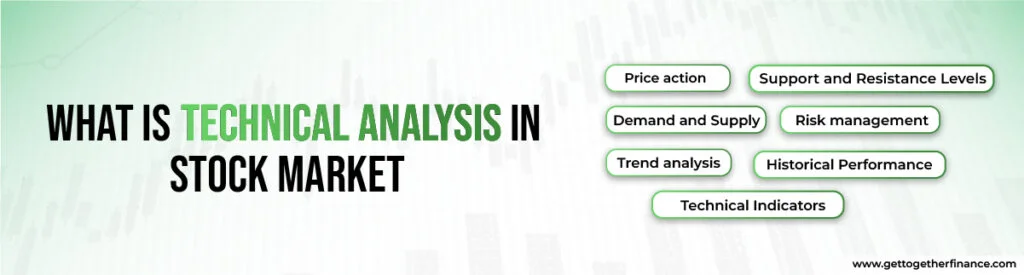
In the stock market, technical analysis is akin to piecing together a jigsaw puzzle. It’s a way to study stocks and guess their future prices based on analyzing historical data, especially studying the price action and traded volume.
Where fundamental analysis reviews the company’s value, sales, and earnings, technical focuses on market psychology, quantitative analysis, and behavioral economics to predict future market behavior and movements. It uses multiple chart patterns to spot the best entry/exit points for potential trades.
Here are simple aspects of technical analysis that traders often consider to understand the market:
- Price action
- Demand and Supply
- Support and Resistance Levels
- Trend analysis
- Risk management
- Historical Performance
- Technical Indicators
Although different traders use different techniques of analysis, it’s suggested to opt for doing the homework right – studying fundamental and technical aspects to make the research foolproof.
What Technical Analysis Tells You

Every trader reads the analysis in different ways, using different theories. Technical analysis is a blanket term that uses a combination of strategies that decode the market moods and stock’s potential direction based on the price action, exchange volume, and demand-supply dynamics.
Most of the analysis strategies that exist (demand-supply, price action, etc.), try to figure out at what point the stock will take a reverse turn, and if not, at what point it will shift it to its reverse gear.
Every trader uses different techniques and some uses a combination of technical indicators and strategies such as Demand-Supply theory, price-action analysis, candlestick formations, etc. to be precise in terms of their predictions. Often it’s about finding the best entry/exit points to get the best out of the market opportunities without any losses.
But remember – the market is all about risks and rewards, with one the other one comes along. It depends on the trading discipline, research, and trader’s psychology how well one can get it right.
The Origin of Technical Analysis
The rumors have it that technical analysis began after the Dow’s theory, West investors, right? But it wasn’t really the origin.
The Early History of Technical Analysis

The beginning of technical analysis can be traced back to the Greek markets and Assyrian (Mesopotamia) trading stations. There is evidence in history that says that they used to keep a track on the price changes and speculations in their commerce.
Further, the prominent evidence of technical analysis can be viewed in the description of Joseph de la Vega in the Dutch markets in the 17th century. Joseph de la Vega, an Amsterdam-based diamond merchant, philosopher, financial expert, and poet wrote the masterpiece, Confusion of Confusions, in 1688. The book highlights detailed descriptions of speculations, calls, puts, pools and techniques to make predictions on the stock market movements.
Further, in the 18th century, Homma Munehisa used a candlestick chart pattern to forecast the price of rice in the Japanese exchange.
Also Read: Fundamental Analysis
The Dow Theory & Evolution of Technical Analysis

Fast forward to the major revolution in analysis which occurred after Charles Dow first introduced this as the Dow Theory in the late 1800s. Robert Rhea, William P. Hamilton, John Magee, Nicolas Darvas, and Edson Gould later added their contribution to this concept with the Dow theory.
These traders reviewed the stock market thoroughly, finding new scales to judge the market highs and lows on charts. In 1948, Robert D. Edwards and John Magee combined the complete study and published Technical Analysis of Stock Trends that contains the gist of all trader’s inventions. From then, analysis has been evolving and includes hundreds of signals and patterns, founded and innovated over time.
Pros and Cons of Technical Analysis

Everything comes with certain merits and setbacks. Before we go ahead, let us introduce the benefits and limitations of technical analysis.
Technical analysis offers a trading toolkit to investors for assessing price trends, identifying opportunities, finding entry/exit points, and exploring other technical insights. However, it doesn’t account for financial health or study other external factors that affect the growth of a company’s stock.
However, the list does not end here. Here we have listed some major pros and cons of technical analysis in brief. Afterall, this is one of the important aspects to look at:
| Pros of Technical Analysis | Cons of Technical Analysis |
| Helps identify trends and potential price movements | Relies on historical data that may not always predict future outcomes accurately |
| Can be used to set specific entry and exit points for trades | Interpretation of charts and patterns can be subjective, leading to different conclusions |
| A more systematic approach to review stocks | Does not account for fundamental factors that can influence stock prices |
| Can be applied to various time frames, from short-term to long-term | May not provide sufficient and qualitative insights for long-term investment |
| Offers a variety of tools and indicators for analysis | May not work well in highly volatile or unpredictable markets |
Technical Analysis v/s Fundamental Analysis
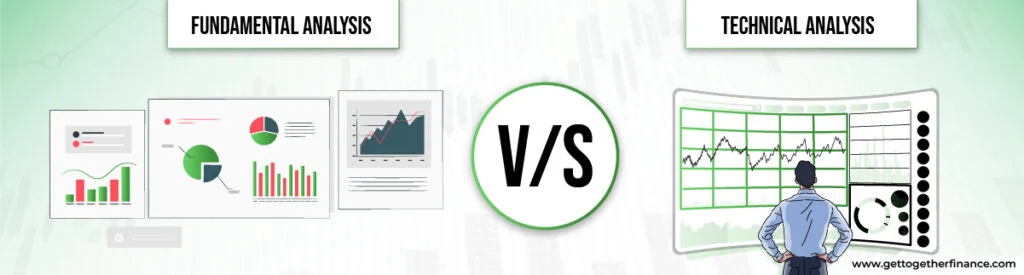
And before we wrap, the most important things – let’s revise the difference between fundamental and technical analysis.
The key difference between fundamental and technical analysis lies in the value it offers. Fundamental analysis checks the comprehensive health record of the overall company, finding out the true intrinsic value of an asset, often for long-term trades. On the contrary, technical analysis studies the trends and share price movements to spot the investment opportunities for both long and short-term trades.
Here we have segregated few differences based on the factors of classification to make it easier to study:
| Aspect | Technical Analysis | Fundamental Analysis |
| Focus | Volume and price movement on technical charts | Financial statements and economic indicators |
| Approach | Past price and volume patterns to predict future | Intrinsic value of a stock based on company’s financials |
| Time Horizon | Short to long-term investment | Long term |
| Tools | Indicators (e.g., moving averages, RSI) | Financial ratios (e.g., P/E ratio, EPS), company news |
| Market Efficiency | Assumes market prices reflect all available info | Believes market prices can be undervalued or overvalued |
| Use in Decision Making | Trading, timing entries and exits | Investment, assessing the overall health of a company |
| Influence of Emotions | Not influenced by emotions, more objective | Subject to biases and emotions |
| Example | Buying a stock based on demand, supply, and price action | Buying a stock with strong financials and growth potential |
Binding The Paper
Technical analysis is a strong analysis tool that helps investors assess historical price movement and direction to make informed decisions and decode potential price movement. Over the years, there are several technical indicators such as Fibonacci retracement that have brought science and mathematical aspects to the stock world that have catered more precision and accuracy in research. But what’s crucial is a robust risk management strategy, investment plan, and balanced trader’s psychology to ace the market moods like a bull.
FAQs
What are the different chart types traders mostly use?
What is technical analysis?
How does technical analysis differ from fundamental analysis?
What are the basic principles of technical analysis?
How can I start using technical analysis to analyze stocks?
What are some common technical indicators and how are they used?
Can technical analysis help me predict future stock prices?
How do I interpret stock charts for technical analysis?
Are there any limitations or risks associated with using technical analysis?
How can I learn more and improve my skills in technical analysis?